Advertisement

News

Aquaculture increases share of EU fishery production

EU25 fishery production fell by 17% between 1995 and 2002; aquaculture share increased, a report by the European Commission shows.
January 12, 2005

In 2002 the EU25 produced nearly 7.6 million tonnes of fishery products1, or about 5% of the world total. Between 1995 and 2002 EU25 production fell by 17%, while world production rose by 17% over this period.


Amongst the Member States, Denmark (1.47 million tonnes) was the largest producer in 2002, followed by Spain (1.15 mio tonnes), France (0.95 mio tonnes) and the United Kingdom (0.87 mio tonnes). These four Member States accounted for almost 60% of the total EU25 production. Between 1995 and 2002 nearly all Member States reported falls in production. The largest falls over this period were registered by Denmark (-570 000 tonnes or -28%), Spain (-260 000 tonnes or -18%), Poland (-200 000 tonnes or -44%) and Italy (-160 000 tonnes or -26%). Only Lithuania (+93 000 tonnes or +157%) recorded a significant increase in production.


Within the EEA, Norway (3.29 million tonnes) and Iceland (2.15 mio tonnes) were the largest producers in 2002. They both recorded an increase in production between 1995 and 2002: Norway (+490 000 tonnes or +17%) and Iceland (+520 000 tonnes or +32%).

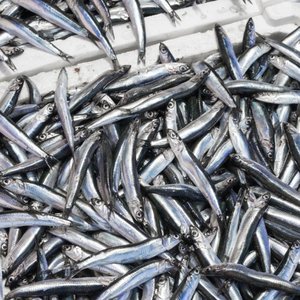
Total catches from all regions accounted for 83% of EU25 fisheries production in 2002. Catches in the Northeast Atlantic alone, at 4.62 million tonnes, made up more than 60% of total EU25 production, with catches in the Eastern Central Atlantic and the Mediterranean accounting for 8% and 7% respectively.


These figures come from a report2 issued today by Eurostat, the Statistical Office of the European Communities.


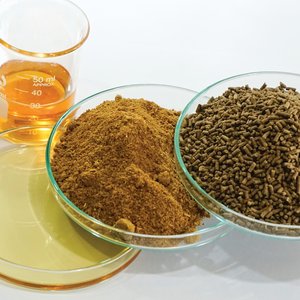
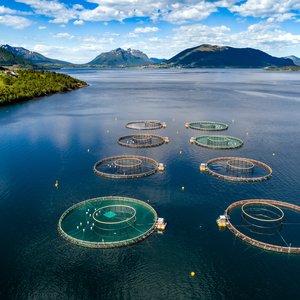
Aquaculture represents 17% of total production

Aquaculture produced 1.27 million tonnes of fishery products in 2002, and has expanded its share of total EU25 production from the one eighth recorded in 1995 to one sixth in 2002. Amongst the Member States, the largest aquaculture producers in 2002 were Spain (260 000 tonnes), France (250 000 tonnes), Italy and the United Kingdom (180 000 tonnes each).


Reduction in the EU15 fishing fleet

Among the EU15 Member States, the largest fishing fleets in 2003 were found in Greece (19 000 vessels), Italy (15 700), Spain (14 400) and Portugal (10 300). These four Member States accounted for two thirds of the total EU15 fleet. Between 1995 and 2003, the EU15 fishing fleet fell by 15%, from 104 000 to 88 000 vessels. All EU15 Member States recorded a fall in the size of their fleets over this period, except France, which rose by 1 500 vessels. The largest falls were registered in Spain (-4 000 vessels), Italy (-3 400) and the United Kingdom
(-2 700).


In terms of total tonnage, the highest figures in 2003 were recorded in Spain (490 000 tonnes), France and the United Kingdom (230 000 tonnes each) and Italy (220 000 tonnes). The total tonnage only declined by 4% between 1995 and 2003, from 2.0 million tonnes to 1.9 mio tonnes. The largest falls were registered in Spain (-110 000 tonnes) and Italy (-30 000 tonnes), and the largest rises in France (+50 000 tonnes) and Ireland (+30 000 tonnes).

Total production, all fisheries products

Thousand tonnes live weight


1995

2000

2002

Change, 2002/1995

EU25

9 193.6

8 168.0

7 596.0

-17%

EU15

8 336.8

7 461.9

6 918.2

-17%

Belgium

36.5

31.7

30.6

-16%

Czech Republic

22.6

24.1

24.2

7%

Denmark

2 043.6

1 577.7

1 474.1

-28%

Germany

302.9

271.1

274.3

-9%

Estonia

132.3

113.4

102.6

-22%

Greece

184.4

194.7

183.6

0%

Spain

1 402.9

1 382.0

1 146.7

-18%

France

955.9

970.1

948.7

-1%

Ireland

417.0

327.5

344.9

-17%

Italy

611.5

518.7

453.8

-26%

Cyprus

9.8

69.4

3.8

-61%

Latvia

149.7

136.7

114.1

-24%

Lithuania

59.1

81.0

151.9

157%

Luxembourg

-

-

-

-

Hungary

16.7

20.0

18.3

10%

Malta

5.5

2.8

2.1

-62%

Netherlands

522.0

571.1

518.5

-1%

Austria

3.3

3.3

2.7

-19%

Poland

454.5

253.5

255.1