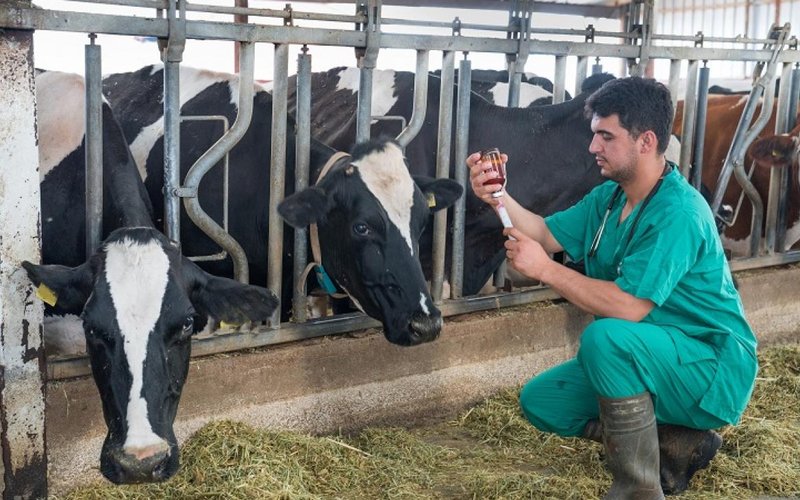
Residues of veterinary medicines and other substances found in animals and animal-derived food continue to fall in the European Union, the latest data from the European Food Safety Authority (EFSA) shows.
EFSA’s monitoring data for 2020 covers 620,758 samples reported by member states, Iceland and Norway. The percentage of samples that exceeded legally permitted maximum levels was 0.19%. This is the lowest figure for the past 11 years when non-compliance ranged from 0.25% to 0.37%. The figure for 2019 was 0.30%.
Compared to 2017, 2018 and 2019, in 2020, compliance rates rose for antithyroid agents, steroids and resorcylic acid lactones. Rises in compliance were also noted for anthelmintics, organochlorine compounds, organophosphorus compounds, dyes and “other substances”, compared to 2017, 2018 and 2019.
Aquaculture
Of the 8,177 samples analyzed for aquaculture, 17 samples (0.21%) and 19 results were non-compliant. The non-compliant samples were reported by nine countries.
For group A (substances having an anabolic effect and unauthorized substances), no non-compliant samples were reported.
In group B1 (antibacterial substances, including sulphonamides, quinolones), three non-compliant samples and five non-compliant results were reported by two countries. In group B3 (other substances and environmental contaminants), 11 non-compliant samples and results, were reported for dyes (B3e) (sum of crystal violet and leucocrystal violet, sum of malachite green and leucomalachite green), by six countries.
One non-compliant sample (one residue) was reported for organochlorine compounds (B3a), and two non-compliant samples and results were reported under chemical elements (B3c).
Check out the report here and the interactive data visualization tool.


